Overview
The Machine Overview is your singular view into a specific machine. This page is made up of three primary sections:
- Processes
- Controls
- Reports
These sections are intended to provide you with quick access to all of the mission critical information you may need about your machine and its operation.
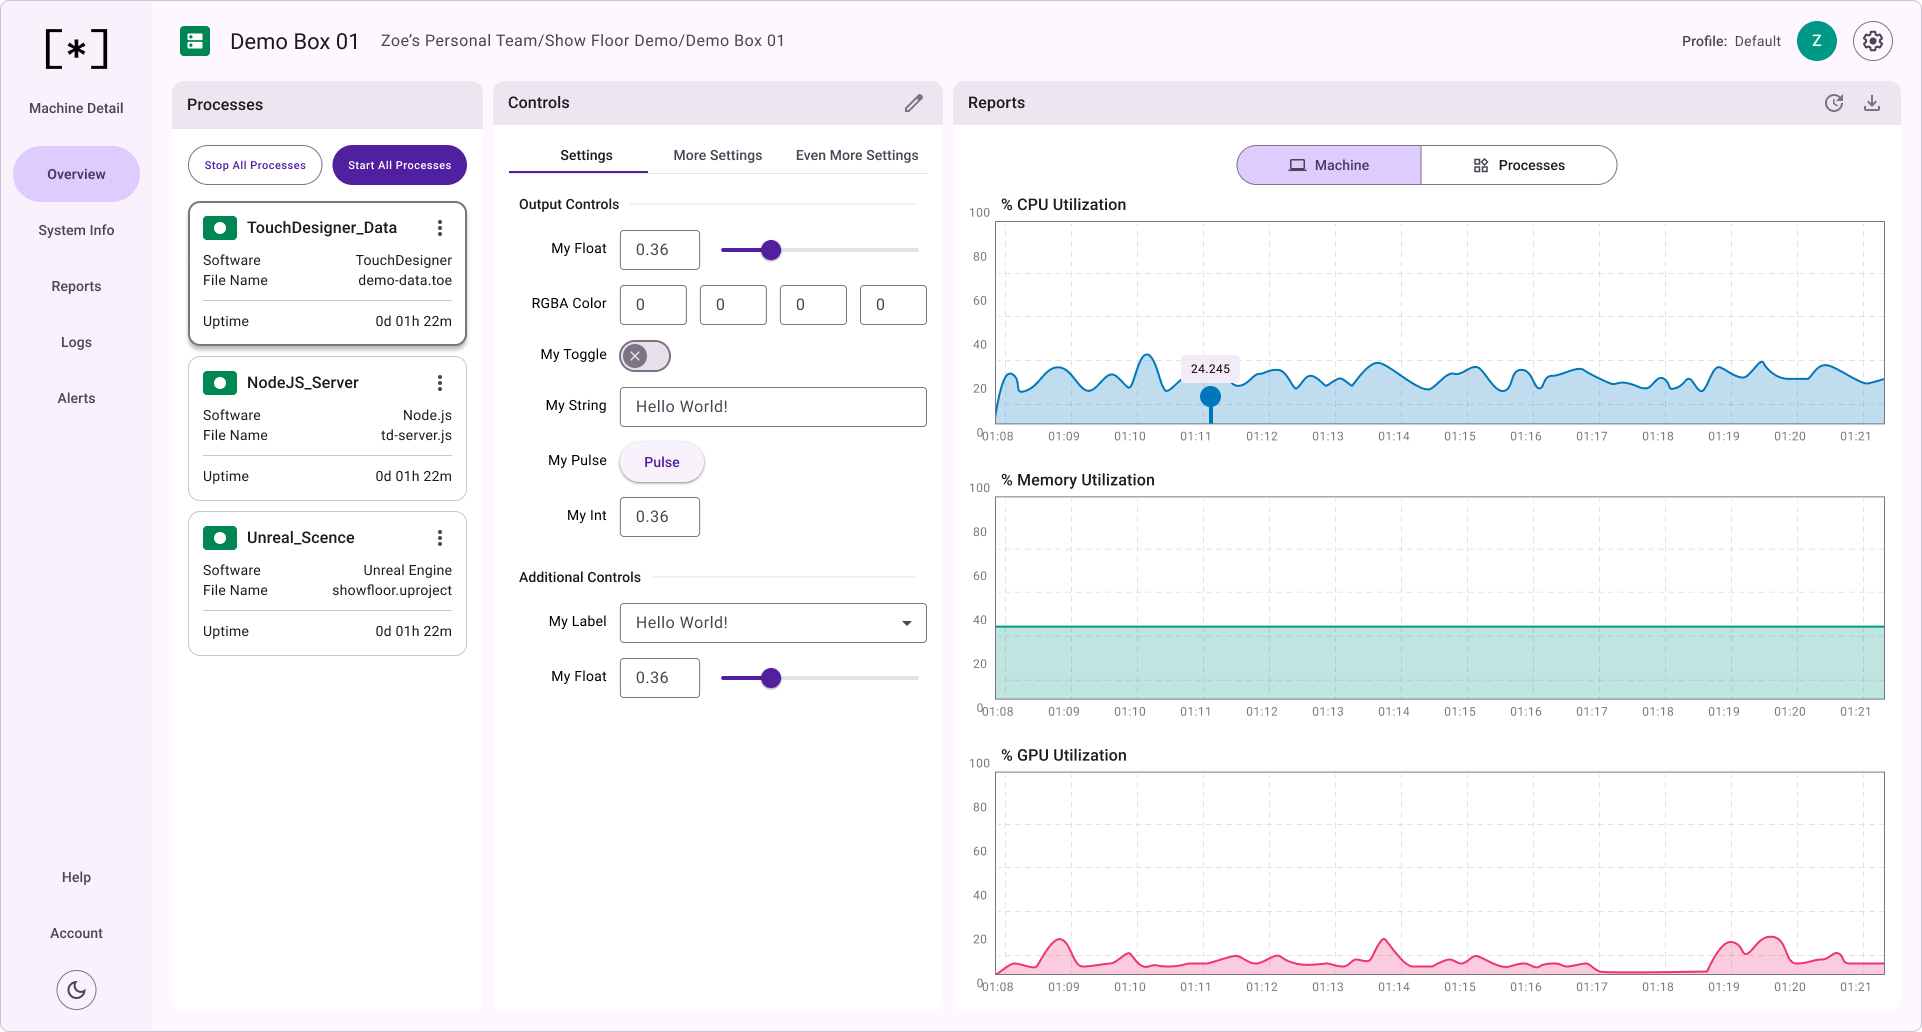
Processes
This section shows a list of all the processes that are communicating with the sudoSignals client on your installation machine.
Stop/Start Processes
The Start All Processes and Stop All Processes buttons can be used to start or stop all Processes that sudoSignals is configured to Auto Start. This gives you the ability to remotely startup or shutdown the applications that are controlled by sudoSignals
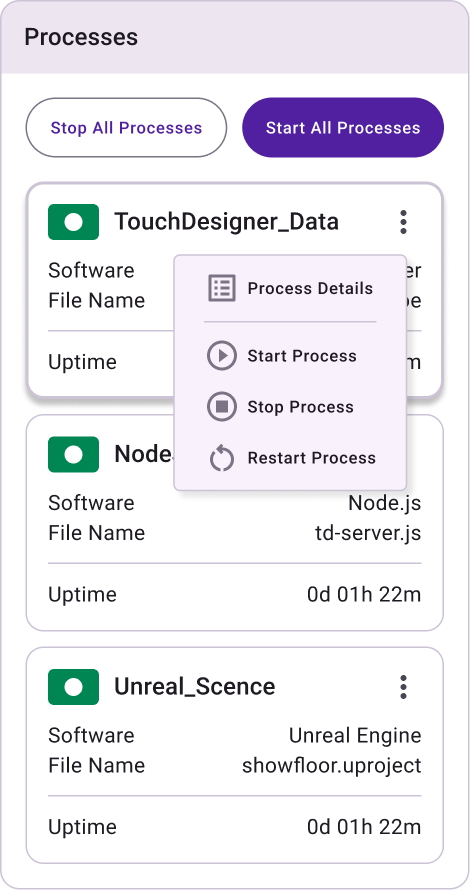
Process Cards
Each process is represented as a small rectangular tile below the Start and Stop buttons. Process cards shows the following:
- Status
- Software
- File Name
- Uptime
Additionally, on process cards there is a menu indicator that opens a dropdown to view Process Details, and start/stop or restart processes on the machine.
Process Details
Clicking on Process Details shows a dialog with an in-depth look at the process.
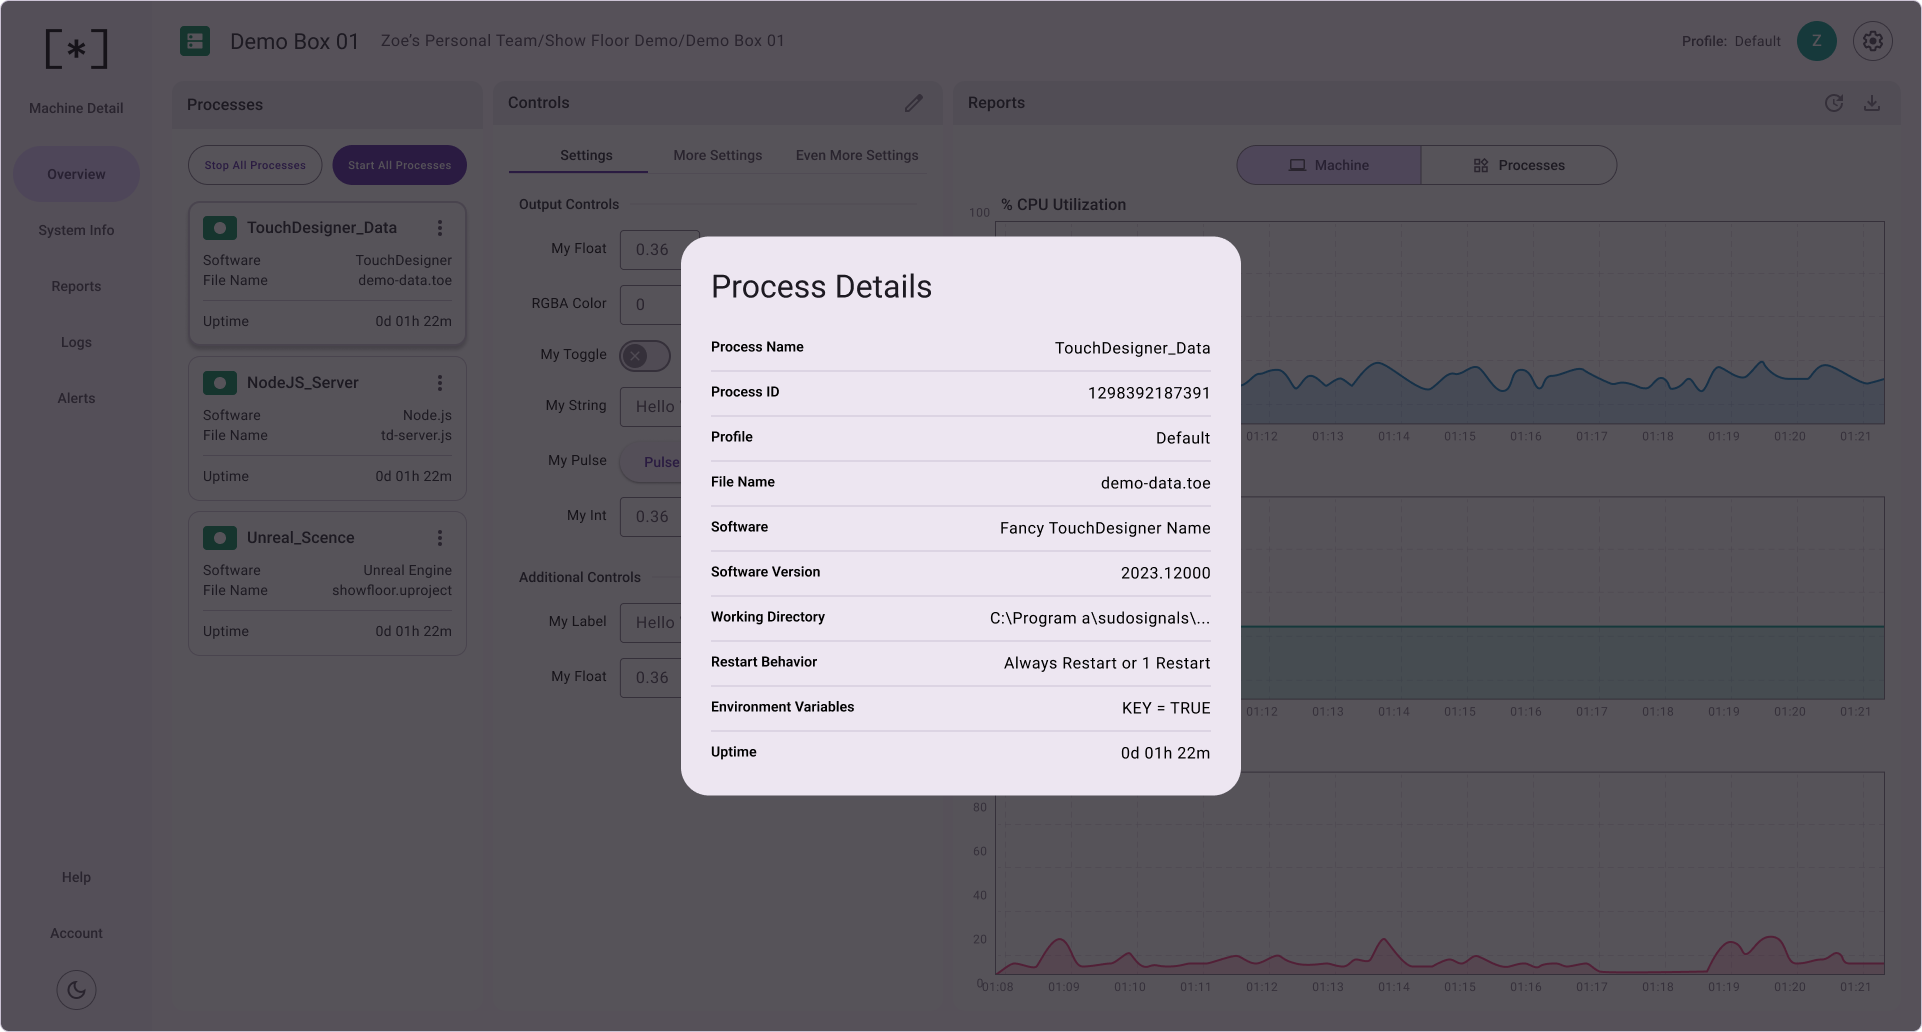
This dialog includes the following information about the process:
- Process Name
- Process ID
- Profile
- File Name
- Software
- Software Version
- Working Directory
- Restart Behavior
- Environment Variables
- Uptime
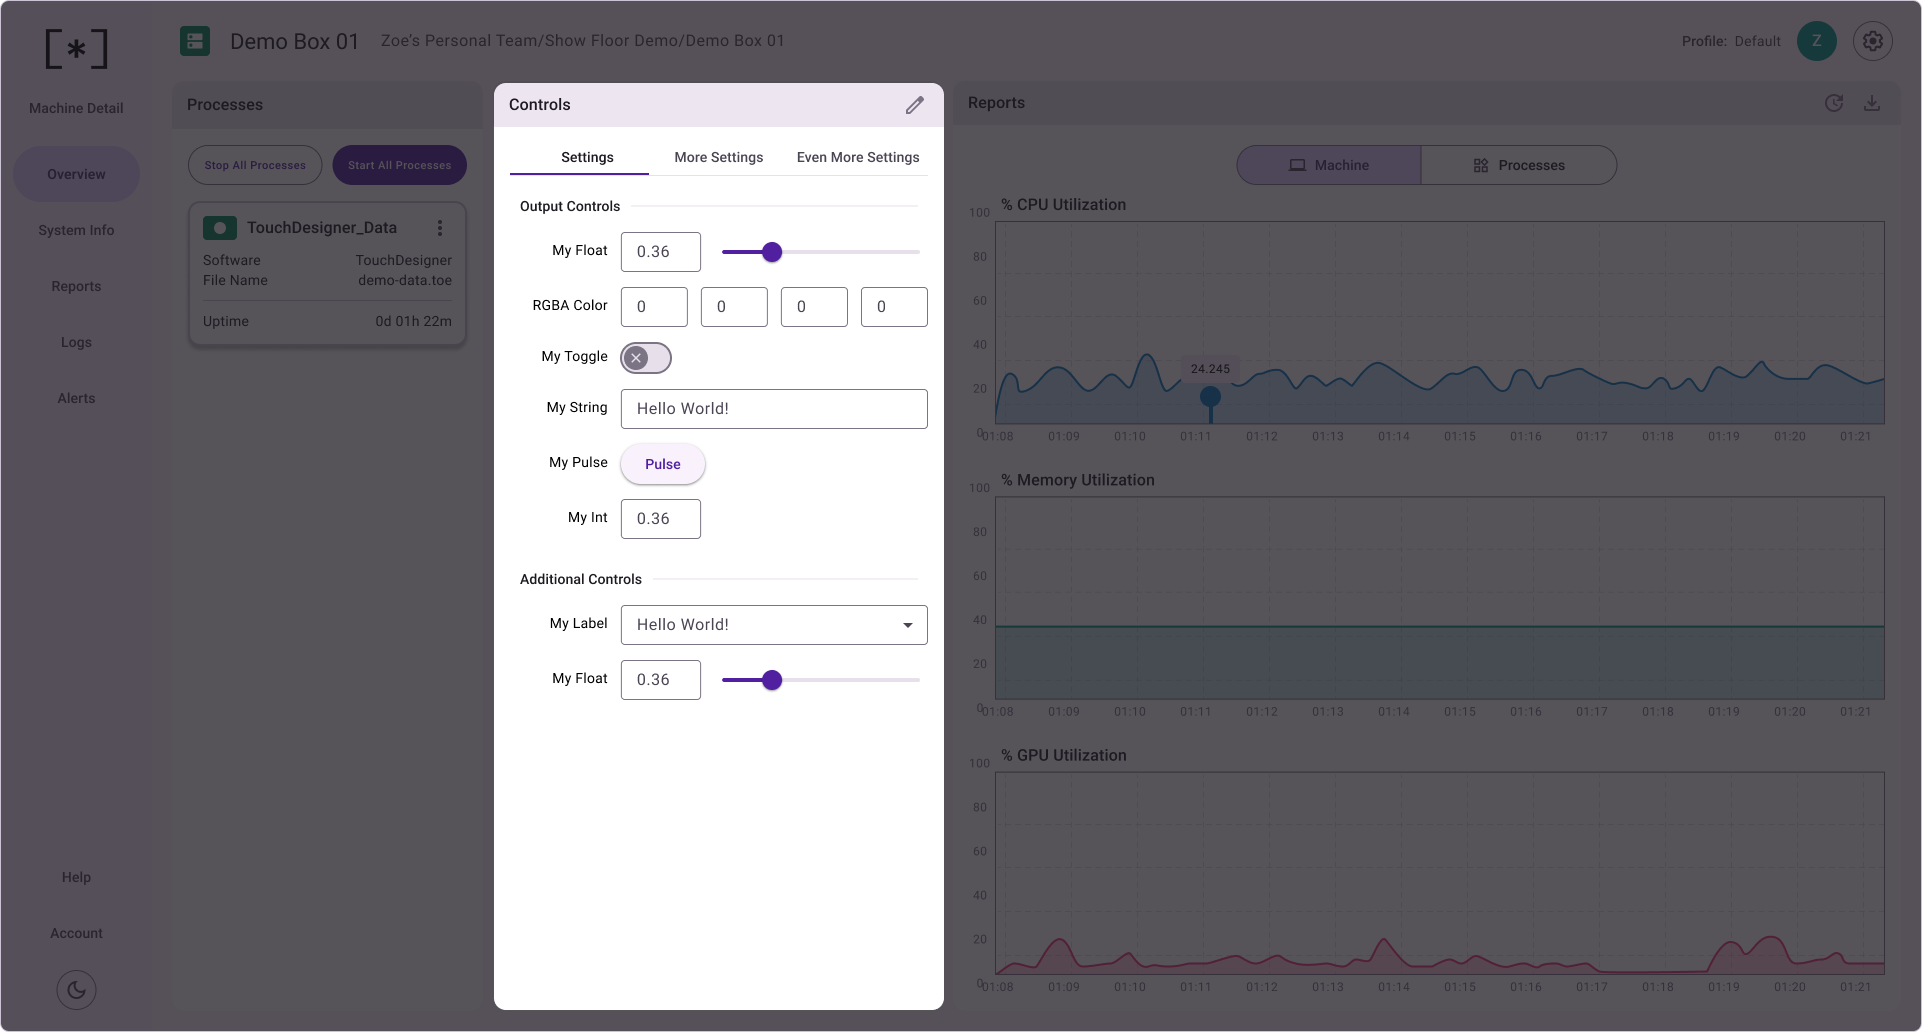
Controls
Controls for a given process are in the central section of this view. Click on a process in the Processes tab to view controls for that specific process. To edit which controls are promoted to the Installation View see
Graphs and Reports
On the right are graphed reports from your machine. Key performance indicators (KPIs) are available at both the Machine and Process level. By default, the KPIs for your machine will be displayed. These metrics are polled directly from the operating system. These graphs give you a quick view of your systems performance over time - allowing you to monitor your machine's performance remotely.
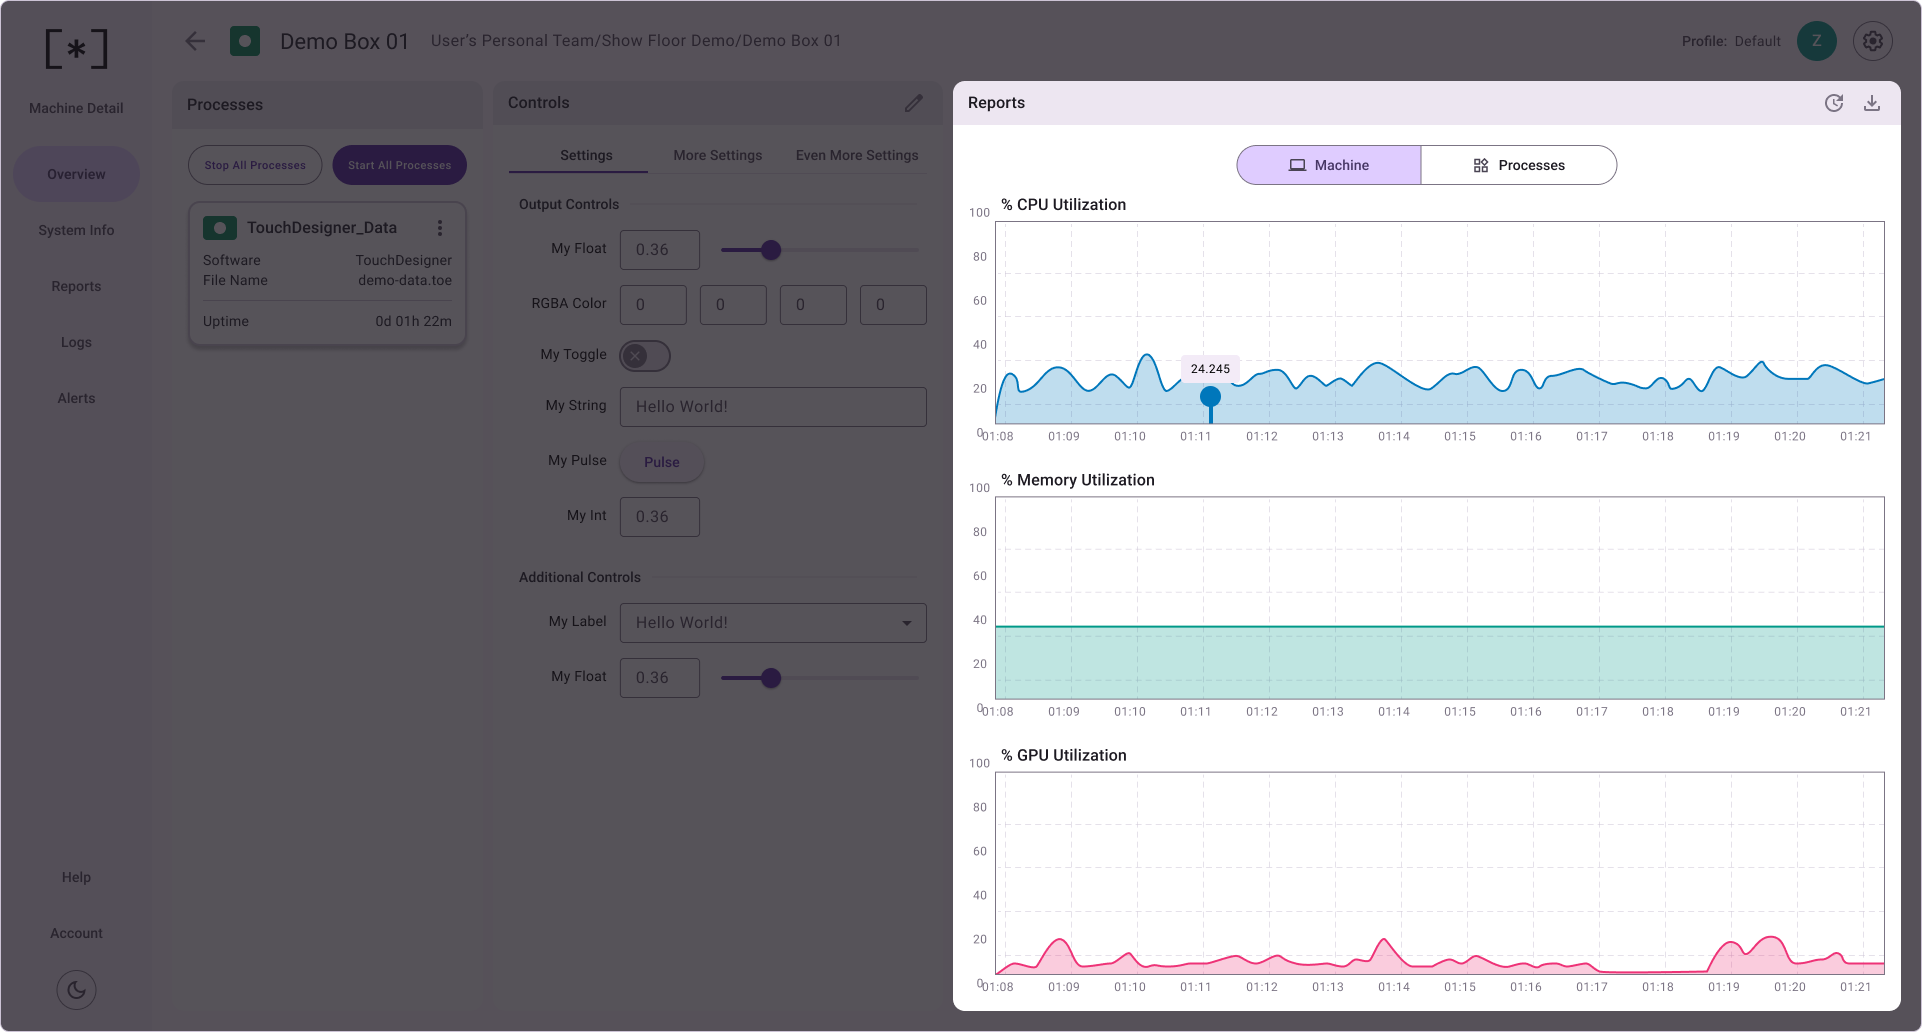
On the top of the graphs, you can toggle either Machine or Process graphs. Each process can also send metrics back to Signals to be displayed in this graph view. The data used for graphs is available for download from the Reports tab.