Overview
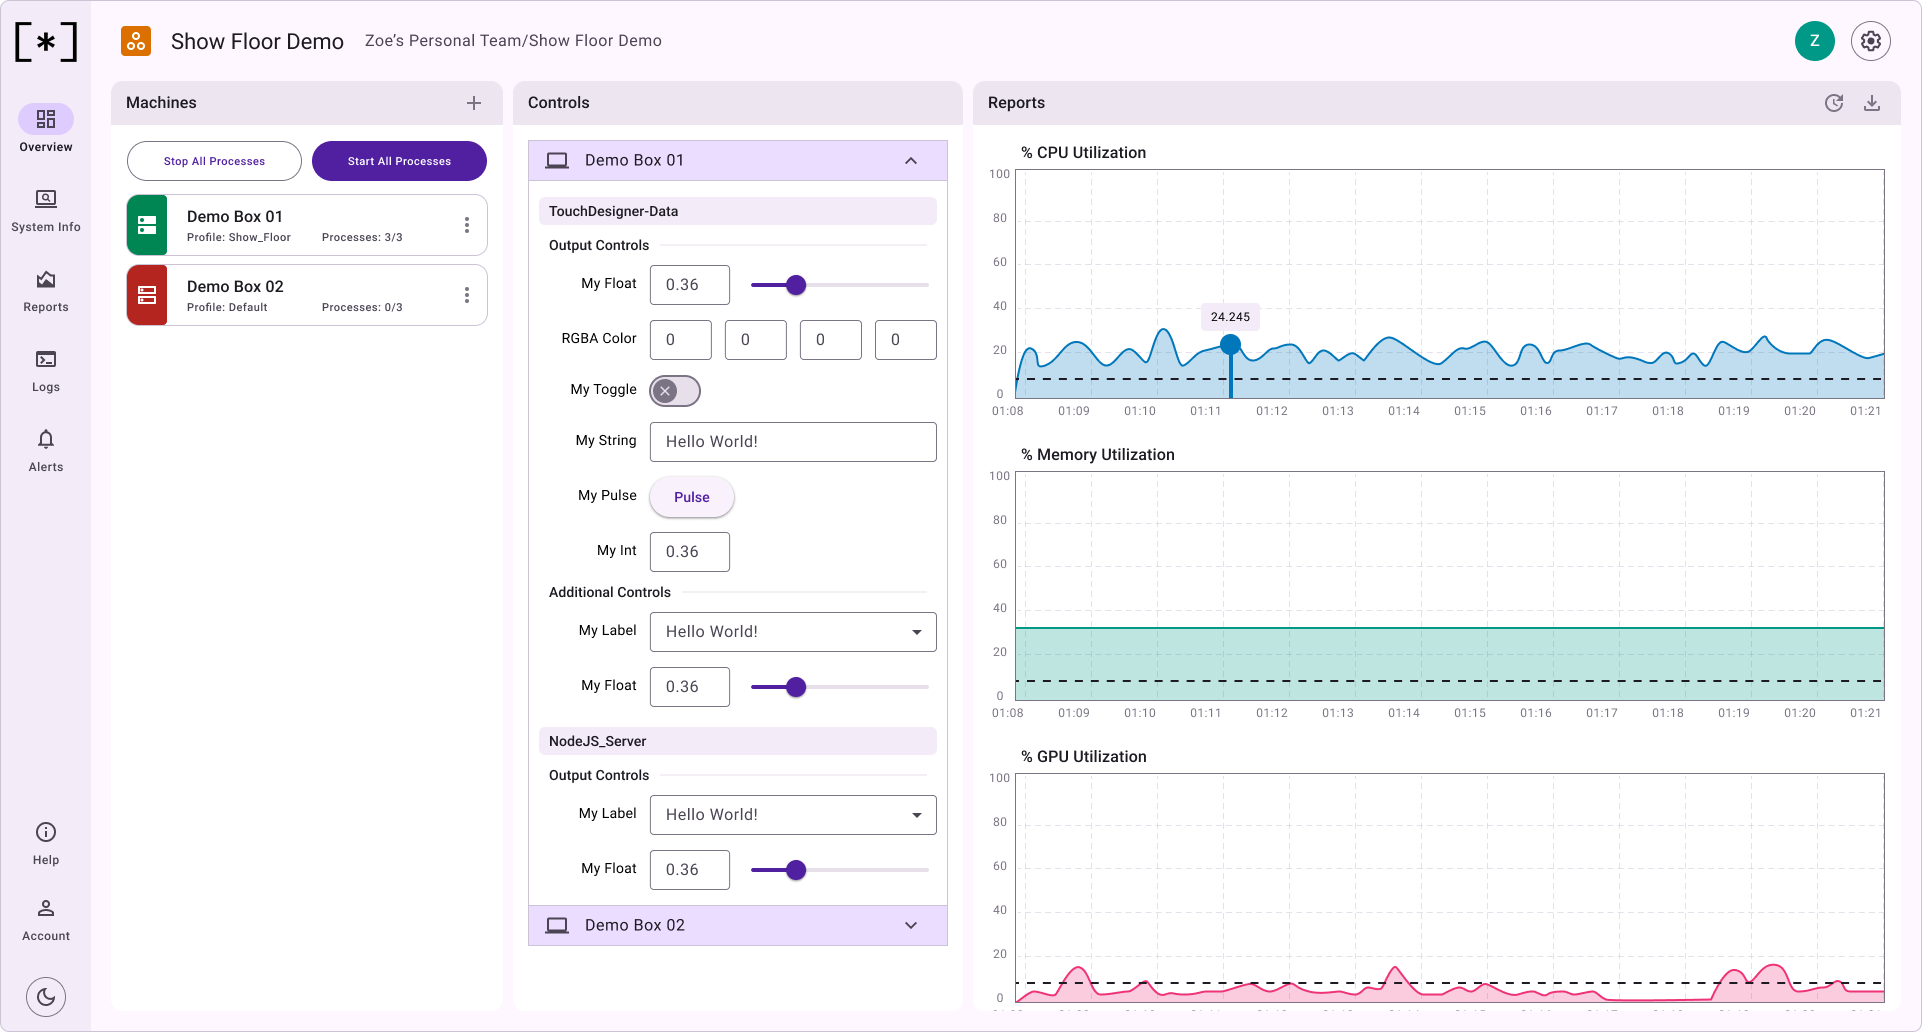
The Installation Overview is your single pane of glass view into your installation. This page is made up of three primary sections:
- Machines
- Controls
- Reports
These sections are intended to provide you with quick access to all of the mission critical information you may need about your installation and its operation.
Machines
This section shows a list of all machines inside of this installation, the ability to add machines, along with the ability to start/stop all processes.
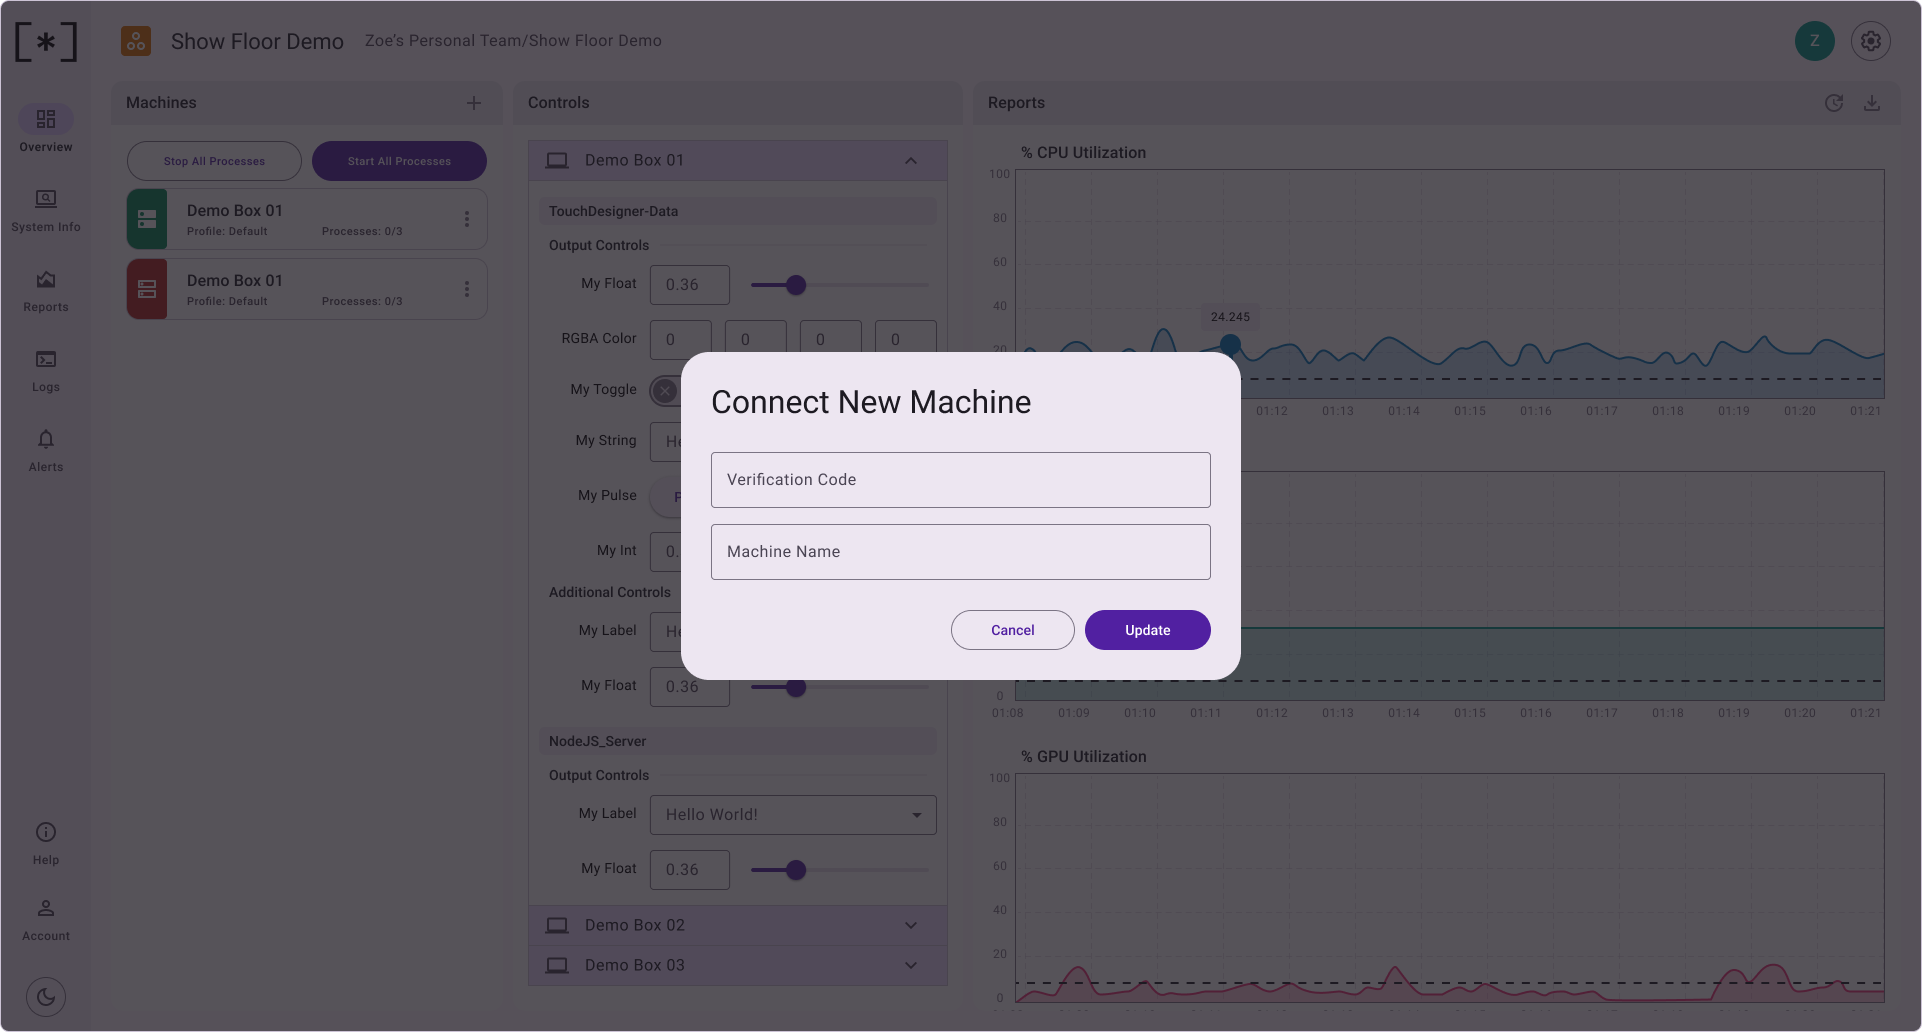
Add Machines
Stop/Start Processes
The Stop All Processes and Start All Processes buttons can be used to start or stop all processes that sudoSignals is configured to Auto Start. This gives you the ability to remotely startup or shutdown the applications that are controlled by sudoSignals.
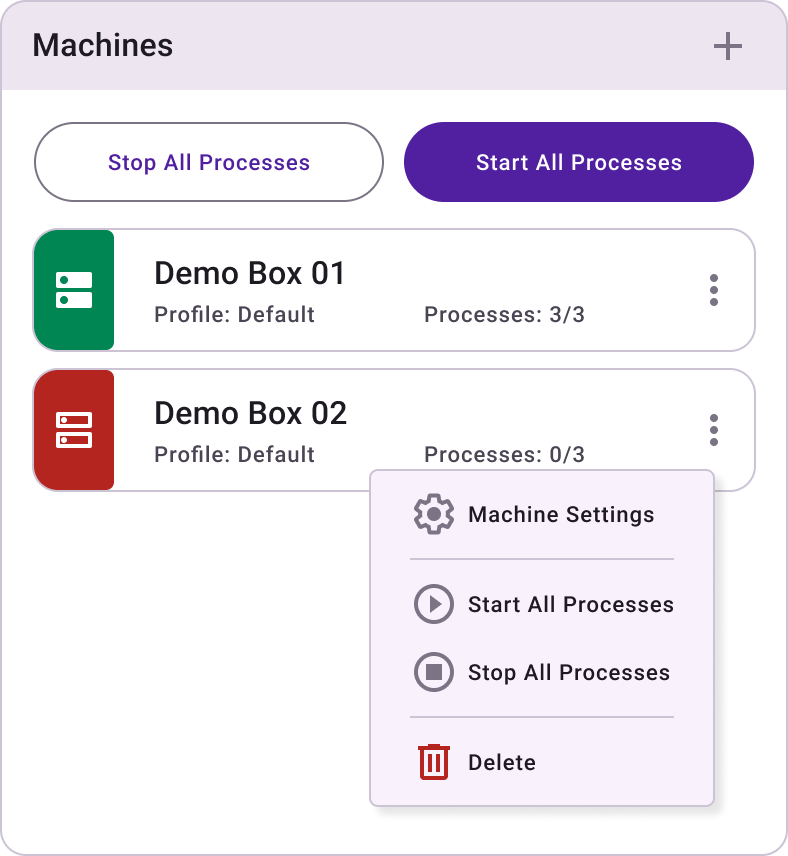
Machine Cards
Machine cards shows the following:
- Status
- Profile
- Processes
Additionally, on the machine cards there is a menu indicator that opens a dropdown to adjust Machine Settings, start/stop processes on that specific machine, and delete the machine.
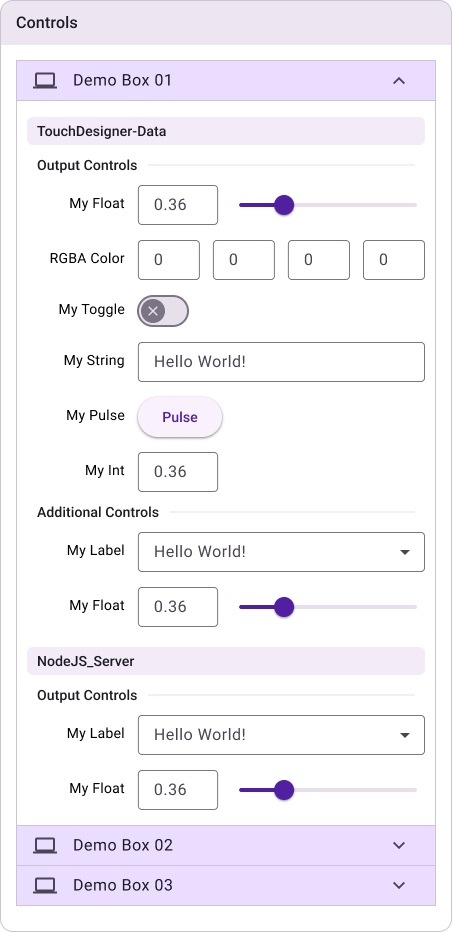
Controls
Controls can be accessed by using one of the SudoMagic developed plugins, or by building your own controls by following the sudoSignals client API. Depending on the environment, the SudoMagic plugins are intended to be drag and drop solutions for fast integration with the sudoSignals dashboard.
The TouchDesigner plugin, for example, lets you quickly mirror your controls from your TouchDesigner project in a web friendly format. Control schemas are pre-defined, and allow for your development team to focus on building compelling experiences rather than creating overly complex dashboard controls.
Reports
On the right are graphed reports from your installation. Key performance indicators (KPIs) are available at both the Machine and Process level. By default, the KPIs for your machine will be displayed. These metrics are polled directly from the operating system. These graphs give you a quick view of your systems performance over time - allowing you to monitor your machine's performance remotely.